Opening the Black Box: My Journey into Machine Learning Explainability by Hakuho Fujiwara
This summer is my first time to have an experience working on machine learning research with my partner under the mentorship of Dr. Roger Stanev. Through this research I also had an honorable opportunity to join the University of Washington Bothell summer research workshops and it taught me hardskills and softskills that I can apply in the future.
I researched machine learning interpretability and explainability which is one of the biggest questions in the domain right now. The question is: how can we understand the outcome of the model? The answer to this question can impact the domain that is strongly connected with our life, like in medical situations, lawsuits, and academia. For instance, if a doctor prescribes a prescription that is generated by a machine learning model, the doctor will not prescribe the prescription without properly understanding the reasoning of the outcome, how the machine learning model gives the prescription. However the problem is – as the task or required outcome becomes more complex, the model also becomes more complex. This leads to a problem where humans cannot understand how the model generates the outcome (and may only be able to understand the outcome by itself) which is the complex machine learning model often called as “Black box model”.
Our research goal was to generate a comparison with different evaluation methods and to show the matrix of how different methods are interpreted in different machine learning methods. I conducted the research by using scikit-learn, an open-source Python library, and some provided California housing data. We chose the scikit-learn library due to the popularity and the simplicity of operation. The California housing data is also common to use for a basic practice.
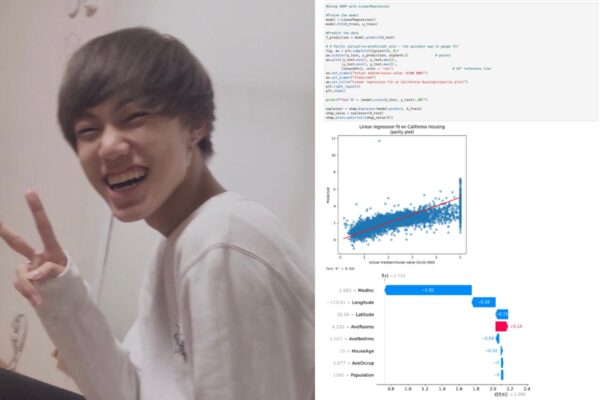
I used the California data to train 6 machine learning models that predict the housing price. The model includes a basic linear regression model to a very complex neural network model. For each trained model we applied an evaluation method called SHAP to see how the method evaluated the models and understand how different models generate the outcome differently.
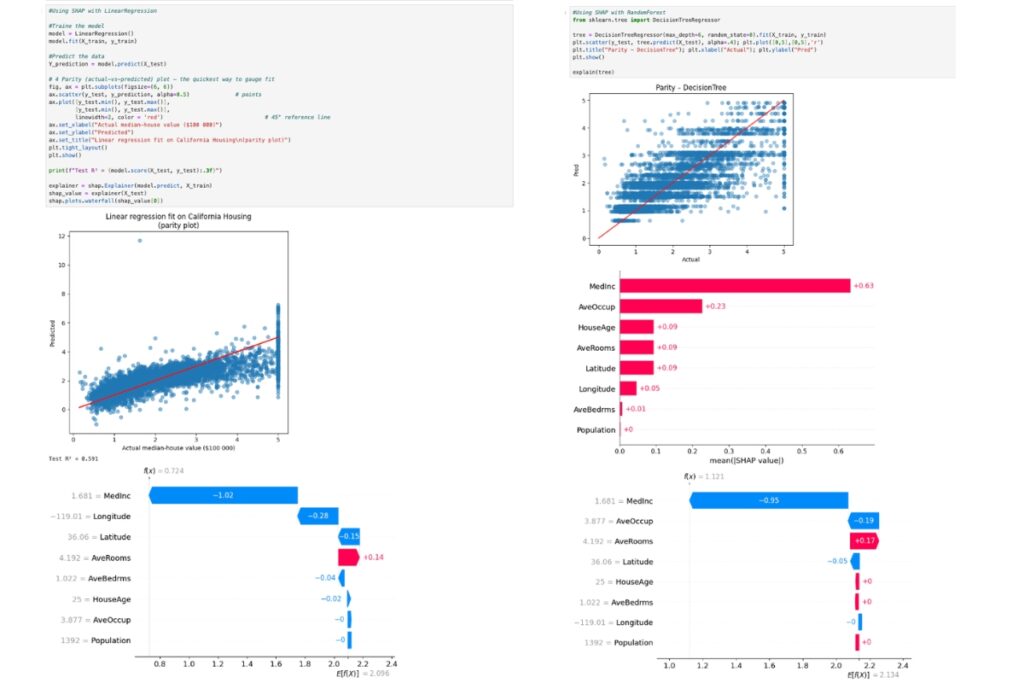
These two images above are from the linear regression model and the random forest model. From both images the bottom graph shows how the model evaluates the data differently by using SHAP to evaluate the outcome of the prediction. For example, the linear regression model takes the AveOccup we negative 0 contribution to the outcome but the random forest model takes it as -0.19 contribution, however both models think the Medinc has a significant negative contribution to the outcome.
Through the summer, I learned how to use different machine learning models and evaluation methods. Also, I encountered challenges like struggling in the reading, understanding new machine learning models and understanding the algorithm of the evaluation methods. There are a lot of other evaluation methods such as LIME and others I will continue to research the machine learning interpretability by involving other evaluation methods.
I think the University of Washington Bothell summer research workshops gave me a road map of research and how to have a research mindset by building time management skills, communication skills with my mentor and professor, and task management skills. These skills will be a key to help me to continue my research after the summer.
One piece of advice I can provide to future researchers is to expect to fail – you may not completely understand what you are doing and get lost. I think it is natural to feel like that since we are facing the edge of human knowledge. When we struggle in unknown knowledge, that is where research starts.
Learn more about the Research & Creative Projects for Undergrads at UW Bothell.