What Climate Data Can Tell Us About Stock Behavior by Thomas Purchas
This summer I looked to tackle the research question of how extreme weather events affected stocks within the energy sector. I found this to be an important question to answer because there appears to be an increased incidence of extreme weather events going on as time passes. It is important to understand the effects of these disruptions because, while investing is often considered the wisest choice of what to do with your money, there is risk involved in investing and understanding what is driving the behavior of the stocks you invest in is a strong method to help mitigate the inherent risk taken on by investing.
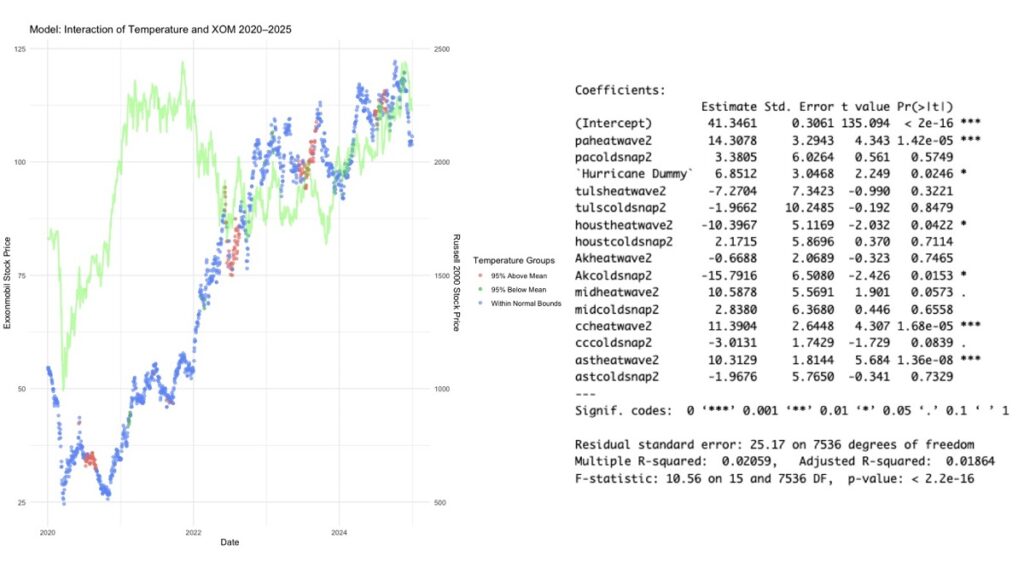
To tackle my research question, I first had to collect data on stocks in the energy sector and climate trends across various regions which are involved in the energy sector. I collected this data from Yahoo Finance and the National Ocean and Atmospheric Administration (NOAA) using Python, and created a dataset containing daily stock and climate data from the beginning of 1995 to the beginning of 2025. With this dataset I began working in R to create regressions showing the interaction of temperature and wind speed on stock prices to see what, if any, affect the weather had on these stocks. I was able to see from this that there were clear statistically significant interactions between the weather and stock prices.
From here I had to constitute what was classified as extreme weather, so I took summary statistics of my data to find seasonal wind and temperature extremes that were over 2 standard deviations from the mean contained in the data. To better understand this data, I also created visualizations to see what was going on in the data over time. From here I created many regressions of different types including multivariable, nonlinear, and logarithmic.
In these regressions I was quite surprised to find that my initial hypothesis, that weather extremes would negatively affect stock prices, was not necessarily true. While windspeeds have been showing a negative effect on stocks, extreme heats have been displaying positive effects on the stock price. While extreme heat may make the work more difficult, my current hypothesis is that this causes an increase in power necessities and therefore oil and gas usage, which is leading to the increased stock price. This is a question that I am continuing to work towards answering and I plan to continue researching.
In this process, I’ve learned many new skills and strengthened skills that I already had coming into this research. This often happened when I came to an obstacle or difficulty and had to find a new way to overcome it. This led to me strengthening skills in R, Python, and Excel and improving my knowledge of working with large datasets.
Initially, a notable problem I faced was matching the weather to the stock dates, in the past on smaller projects I’ve just matched things like this by hand, however with over 11,000 days of climate data in nine regions and over 7,000 days of stock data for seven stocks, this would’ve been incredibly time consuming. I was able to work around this by looking online for different excel shortcuts to automate this task and to effectively maneuver around within so many columns and rows. Additionally, at times I found it difficult to figure out how best to move forward when my regressions were giving me results that were contradictory or didn’t make sense. With these issues I was able to reach out to my mentor, Dr. Wei, and take advantage of the massive amounts of experience and knowledge that she has in this area.
With this research I have come to better understand how research isn’t always a linear process and can be quite different from assignments that you may receive in classes. Research isn’t always clean and clear-cut, instead often requiring tangents to better understand the situation, and sometimes requiring you to go back to earlier stages in a research plan when the results aren’t exactly what you thought they would be. Despite this, I quite enjoyed this process and plan to continue my research and improve and expand upon the results I have already received in anticipation of my presentation at the 2025 INFORMS Annual Meeting.
For other future researchers, I have several pieces of advice. First, be sure to budget plenty of time for the initial data collection and management in your research, working with a large dataset can be quite time consuming in both the collection and cleaning of your data. Additionally, don’t be afraid to reach out to your mentor. With many difficulties you may face, it is likely that your mentor has been in a similar position as you before – and has overcome it successfully. Even if they don’t have an immediate way to figure out what you are having difficulty with, they may be able to recommend resources that you could look into or potential alternative ways to get around what is causing your difficulties.
Learn more about the Research & Creative Projects for Undergrads at UW Bothell.